By the numbers
The Commission reviews every complaint it receives, and tries to resolve as many as possible informally and quickly. In many cases, we refer the complaint to the appropriate dispute resolution process.
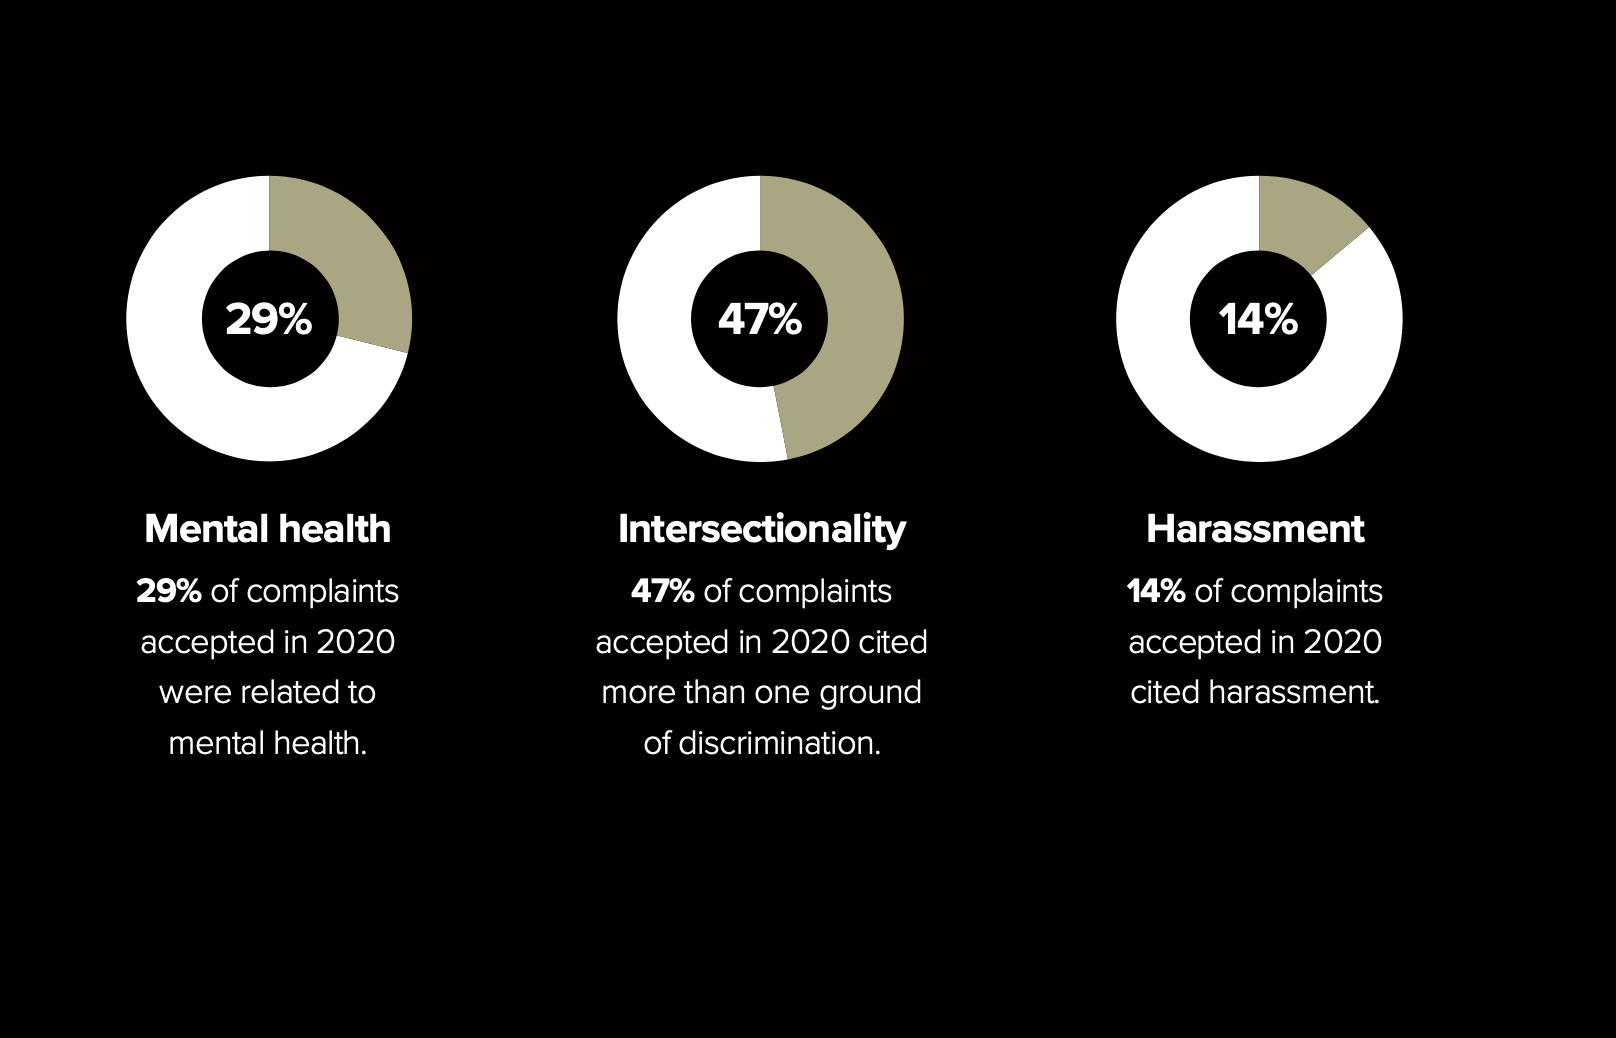
The statistics outlined in this section break down those complaints in 2020 that the Commission was able to mediate, investigate or litigate because they met the criteria outlined in Canadian Human Rights Act.
Throughout the process, Commission staff tailor the services they provide to best meet the needs of those asking for help. Whenever possible, the Commission encourages people to try to resolve their discrimination complaint informally and at the earliest opportunity. This often involves mediation.
When warranted, the Commission can refer the case to the Canadian Human Rights Tribunal for a hearing. In many cases, the Commission will participate in the hearing to represent the public interest.
The following numbers are related to complaints that met the requirements outlined in Canadian Human Rights Act.
49,000
people
contacted the Commission to complain in 2020
Most were helped without needing to file a complaint
1,030
complaints
were accepted by the Commission in 2020
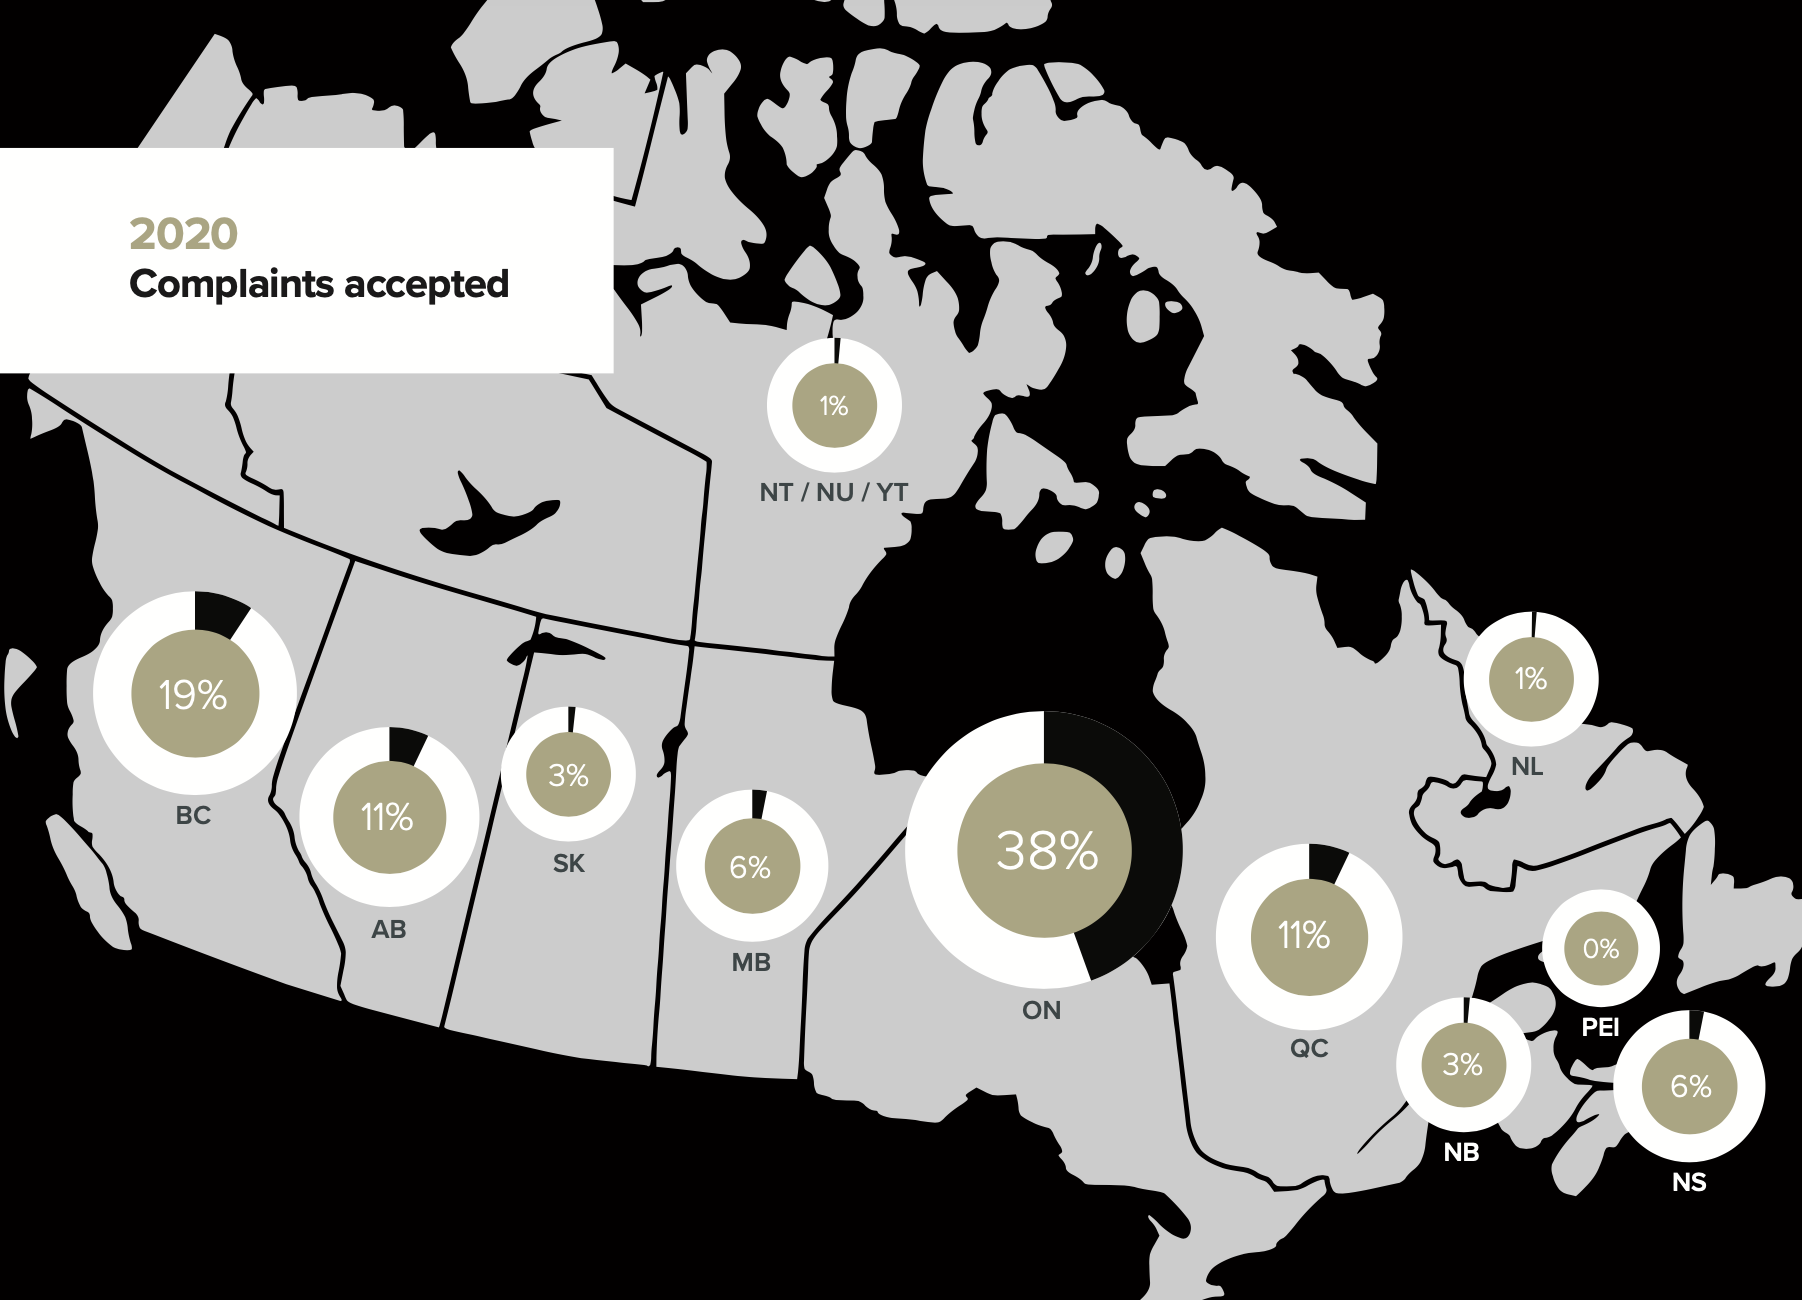
2020 Complaints accepted - Text version
| Canadian provinces and territories | % Complaints accepted |
|---|---|
| Nova Scotia | 6% |
| Prince Edward Island | 0% |
| New Brunswick | 3% |
| Newfoundland and Labrador | 1% |
| Quebec | 11% |
| Ontario | 38% |
| Manitoba | 6% |
| Saskatchewan | 3% |
| Alberta | 11% |
| British Columbia | 19% |
| Yukon, Northwest Territories and Nunavut | 1% |
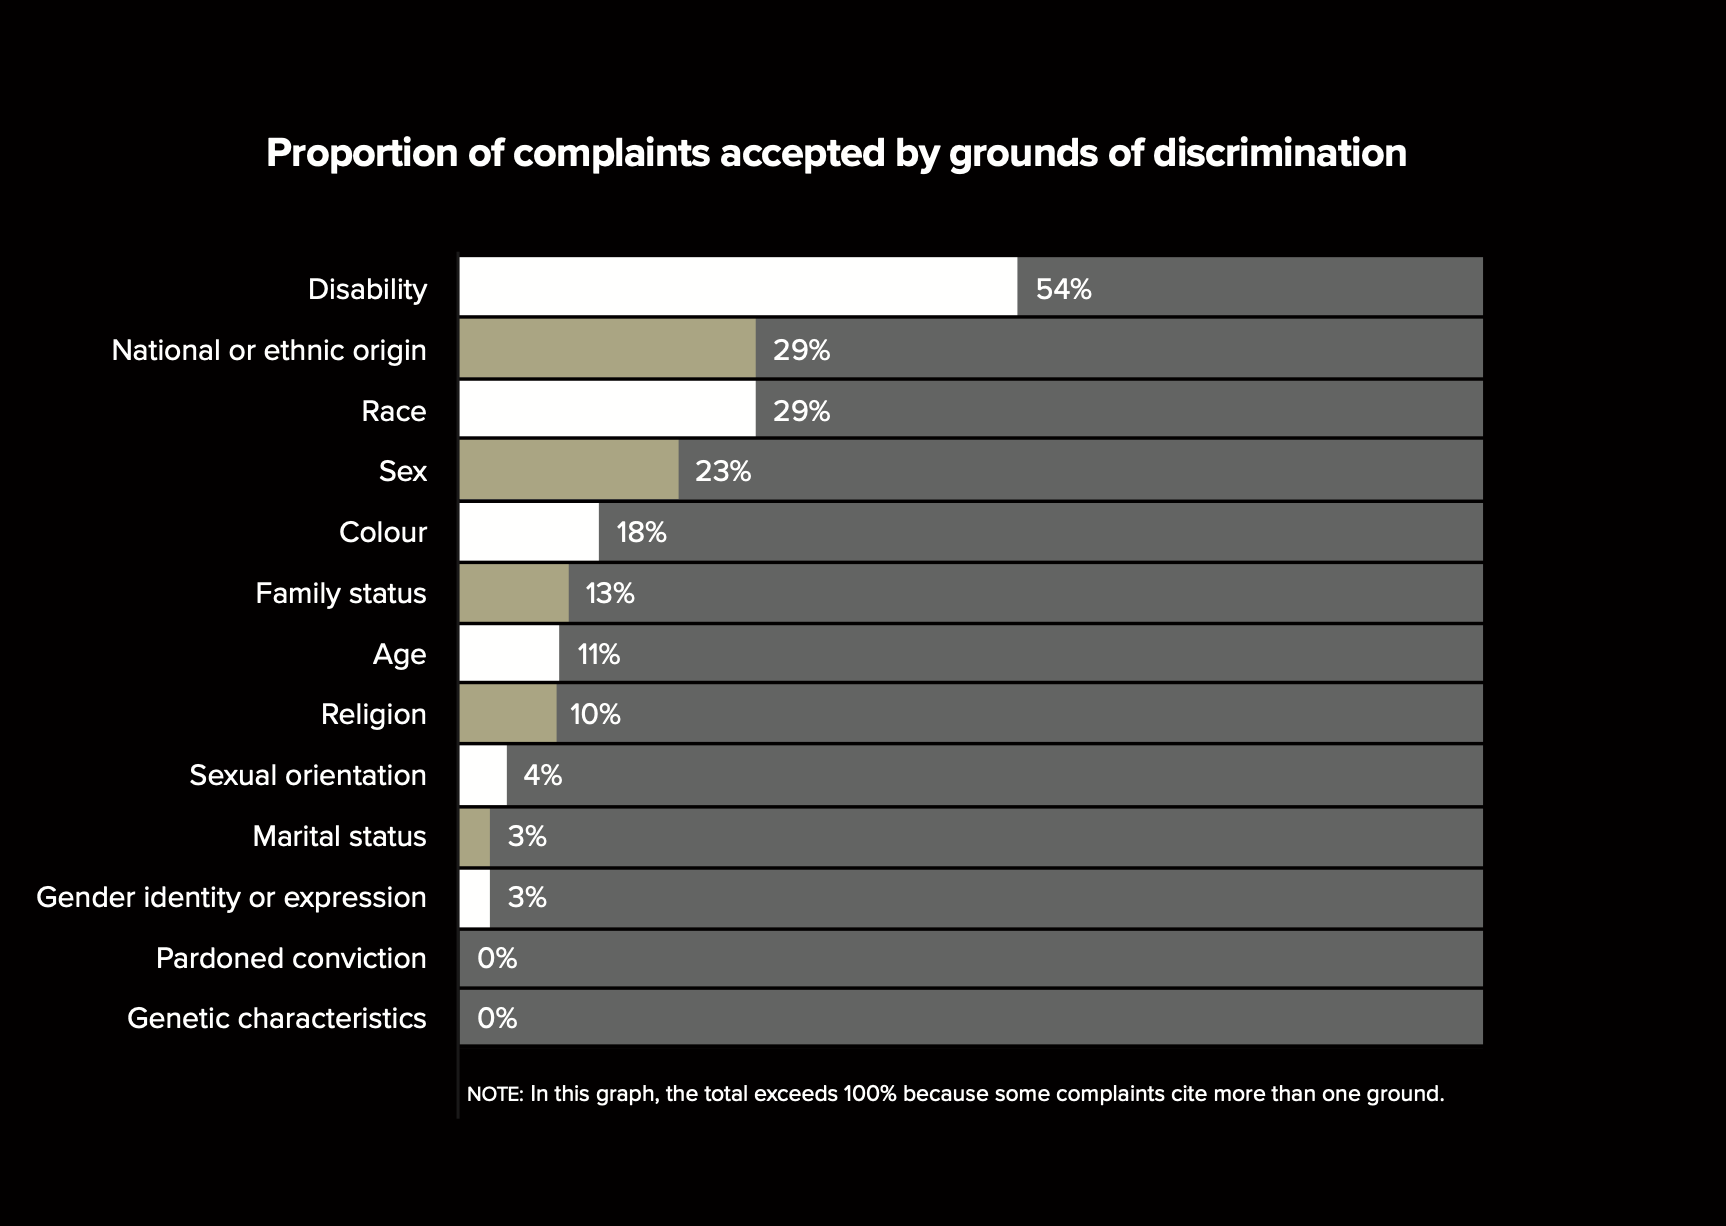
Proportion of complaints accepted by grounds of discrimination - Text version
| Grounds of discrimination | % of complaints accepted |
|---|---|
| Disability | 54% |
| National or ethnic origin | 29% |
| Race | 29% |
| Sex | 23% |
| Colour | 18% |
| Family status | 13% |
| Age | 11% |
| Religion | 10% |
| Sexual orientation | 4% |
| Marital status | 3% |
| Gender identity or expression | 3% |
| Pardoned conviction | 0% |
| Genetic characteristics | 0% |
Note: In this graph, the total exceeds 100% because some complaints cite more than one ground.